分散と標準偏差について解説します。
この範囲は「データサイエンティストのためのスキルチェックリスト」の「データサイエンス力」項目No.4の解説になります。
多くの専門用語や公式が登場しますが丁寧に理解しやすく説明していきます。
本記事はデータサイエンスを研究されているIffat Maabさんによる英語の解説を翻訳しています。
Iffat Maab
東京大学大学院工学系研究科技術経営戦略学専攻(TMI)博士課程在学中。パキスタン、イスラマバード市出身
マーケターのためのデータサイエンスの時間とは?
こちらの講座では、一般社団法人データサイエンティスト協会様がリリースしている「データサイエンティストのためのスキルチェックリスト」に沿った解説を行っていきます。
「データサイエンティストのためのスキルチェックリスト」とは、データサイエンティストとして活躍するために必要なスキルが体系化されたものです。

このマーケターのためのデータサイエンスの時間に従って学習していくと、データサイエンティストに必要なスキルセットである「データサイエンス力」を一通り学習することが出来ます。
与えられたデータにおける分散と標準偏差が計算できる
解答
分散:
標準偏差:√分散
解説
こちらは分散と標準偏差に関する問いです。これらの値の求め方を知ることででデータセットをより統計的に見ることが出来ます。
どちらも「データセットの平均値からのばらつき、数値の散らばり方を表したもの」になっています。
分散
分散は、データが平均からどのように離れているかを示す指標です。言い換えれば、データのばらつき具合を表す指標と言えます。
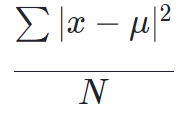
初めに、こちらが分散の公式になります。
ここで文字式の説明です。∑(シグマ)は”総和”を意味し、xは”データセット内のそれぞれの値”を表しています。そして、μ(ミュー)は前回説明したデータセットの”平均値”、Nは母集団内の”データの数”です。
x – μとなっているΣ内の求め方としては、①それぞれのデータを平均値で引き差を求める、②それぞれの差の2乗を全て足す、という手順になっています。
最後に、Σの結果をデータ数で割れば分散を求めることが出来ます。
つまり、「それぞれのデータと平均値の差」を2乗し、データの数で割ったものが分散になります。
標準偏差
標準偏差も、データが平均からどのように離れているかを示す指標です。分散と表しているものは同じですが計算過程が異なっているだけになります。
そして、これは英語で “Standard Deviation”であり、SDと略されることがあります。
こちらが標準偏差の公式です。
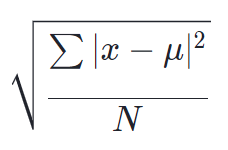
見ていただけると分かる通り分散の公式に√を付けただけの計算式になっています。
電卓では算出した分散に√のボタンを押すだけで算出することが出来ます。
標準偏差と分散の違い
上述の通り、データが平均からどのように離れているかを示す指標です。
しかし、分散の平方根(√)をとったものが標準偏差になっています。
分散と標準偏差の違いとして、
標準偏差=√分散
という計算過程の違いを上げることが出来ます。
分散と標準偏差の計算例
母集団データの分散と標準偏差を計算してみましょう。
母集団データを「2、4、5、5、6、8」とします。
①先ほどの公式から分かるように平均と分散は相互に関連しているため、初めに平均値を求めなければなりません。
まず、平均値を求めるには、次のようにします。
平均値 = ( 2 + 4 + 5 + 5 + 6 + 8 ) / 6 = = 5
ここで、平均値が5であることが分かりました。
②次に、分散を計算するには平均値からそれぞれの差を計算し、それを二乗し、データ数で割ります。
つまり、このデータの分散は、
σ2 = ( (-3)2 + (-1)2 + 02 +02 +12 +32 ) / 6
σ2 = (9 + 1 + 0 + 0 + 1 + 9) / 6
となります。
ここで、分散 = 3.333
と分かり、この値に√を用いて標準偏差を求めると、
標準偏差 = √3.333 = 1.825
という値が求められます。
答え:分散= 3,33、標準偏差=1.83
目的
実際の統計では,母集団全体のデータを用いることはほとんどありません。母集団は非常に大きなデータです。
そこで、母集団が大きすぎる場合は標本を抽出することが有効です。母集団から無作為に抽出された標本の分散または標準偏差は、データのセットが平均からどのくらい離れているか、または特定の標本が大きな母集団にどのくらいのばらつきを持っているかを知ることができます。
このように、分散と標準偏差はデータをより統計的に見るために必要な値となっています。
以下の計算ツールを使用すると、データセットの分散と標準偏差を簡単に求めることができます。
日本語:CASIO|Keisan – 度数分布の平均・標準偏差
英語:SCIENCE BUDDIES|Variance & Standard Deviation
まとめ
以上が「データサイエンス力」のNo.4の解説になります。
English
The variance and standard deviation of the population data (2,4,5,5,6,8) can be calculated using a calculator.
Standard deviation
Statisticians calculate the Standard Deviation (SD) by hand as there is no point in doing the calculations manually because the chance of mistake is high. This can be illustrated by the use of SD formula
where ∑ means the sum and x is a value in the data set, μ (pronounced as mu) is the mean of the data set as explained before, and N is the number of data points in the population.
Standard deviation (SD) measured the volatility or variability across a set of data. It is the measure of the spread of numbers in a data set from its mean value and can be represented using the sigma symbol (σ). The following algorithmic calculation tool makes it easy to quickly discover the mean, variance & SD of a data set.
Standard deviation and Variance
Standard deviation is the positive square root of the variance. The symbols σ and SD are used correspondingly to represent population and sample standard deviations.
Variance
Variance is a measure of how data points differ from the mean. According to Layman, a variance is a measure of how far a set of data (numbers) are spread out from their mean (average) value.
In statistics, the variance is used to understand how different numbers correlate to each other within a data set, instead of using more comprehensive mathematical methods
Calculation of variance and standard deviation
Let’s calculate the variance and standard deviation of the given population data
The population data includes 2, 4, 5, 5, 6, 8
Mean and Variance are interrelated. The first step is finding the mean which is done as follows,
Mean = ( 2 + 4 + 5 + 5 + 6 + 8 ) / 6 = 30 / 6 = 5
So the mean average is 5.
To calculate the Variance, compute the difference of each from the mean, square it and then find the average once again.
So for this particular case the variance is :
σ2 = ( (-3)2 + (-1)2 + 02 +02 +12 +32 ) / 6
σ2 = (9 + 1 + 0 + 0 + 1 + 9) / 6
Final answer : Variance = 3.333
Standard deviation = √3.333 = 1.825
Purpose
When doing some real life project, you will almost never have access to data for an entire population. For example, you might be able to measure the height of everyone in your classroom, but you cannot measure the height of everyone on Earth. If you are launching a ping-pong ball with a catapult and measuring the distance it travels, in theory you could launch the ball infinitely many times. In either case, your data is only a sample of the entire population. This means you must use a slightly different formula to calculate variance, with an N-1 term in the denominator instead of N. Hence for a large population set/ data, variance or standard deviation of the random sample of the population gives an idea of how far a set of data is spread from their mean or how much variation a particular random sample is carried by a large population.
著者情報