二項分布について解説します。
この範囲は「データサイエンティストのためのスキルチェックリスト」の「データサイエンス力」項目No.11の解説になります。
多くの専門用語や公式が登場しますが丁寧に理解しやすく説明していきます。
本記事はデータサイエンスを研究されているIffat Maabさんによる英語の解説を翻訳しています。
Iffat Maab
東京大学大学院工学系研究科技術経営戦略学専攻(TMI)博士課程在学中。パキスタン、イスラマバード市出身
マーケターのためのデータサイエンスの時間とは?
こちらの講座では、一般社団法人データサイエンティスト協会様がリリースしている「データサイエンティストのためのスキルチェックリスト」に沿った解説を行っていきます。
「データサイエンティストのためのスキルチェックリスト」とは、データサイエンティストとして活躍するために必要なスキルが体系化されたものです。

このマーケターのためのデータサイエンスの時間に従って学習していくと、データサイエンティストに必要なスキルセットである「データサイエンス力」を一通り学習することが出来ます。
<マーケターのためのデータサイエンスの時間の全一覧はこちら>
二項分布の事象もサンプル数が増えていくとどのような分布に近似されるかを知っている
解答
二項分布の事象でサンプル数が増えていくと正規分布に近似される。
解説
二項分布の事象でサンプル数が増えていくと正規分布になることが知られています。
しかし、一般的にはこの証明は非常に複雑で長くなる為この事実を覚えていることが大切となっています。
そこで、証明ではなく二項分布とは何かについて解説しましょう。
二項分布
二項分布とは結果が2つの場合の試行を繰り返して片方の結果を変数にする確率分布の事です。
例えば、「100円玉を投げたときに表が出るか裏が出るか」という時には、表か裏かの2つの結果しか起こりえません。
二項分布では、このような2つの結果しかもたない試行の結果を確立分布で表します。
他にも、ダーツを10回投げて的に当たる/当たらない、サイコロを10回降って4の目が出る/それ以外が出る といったものも当てはまります。
ちなみに、結果が2つしかない試行をベルヌーイ試行といいます。この言葉は二項分布の分野で出る確率が多いので覚えておきましょう。
そして、二項分布では分かりやすくするために2つの結果を 成功/失敗 として扱うことが多いです。先ほどのコイントスの場合では、表か裏のどちらかを「成功」とし、もう片方を「失敗」になります。
そして、成功と失敗の確率は常に一定ということもベルヌーイ試行の条件になっており、成功確率をp、失敗確率をqと表すことも多く、覚えておく必要もあります。
このようなベルヌーイ試行の結果を確立分布で表したものが二項分布になります。
二項分布と正規分布の近似
それでは、実際に二項分布を見てみましょう。
ベル型をしており左様対照な形をしています。そして、この形はどこかで見たことがあると思います。
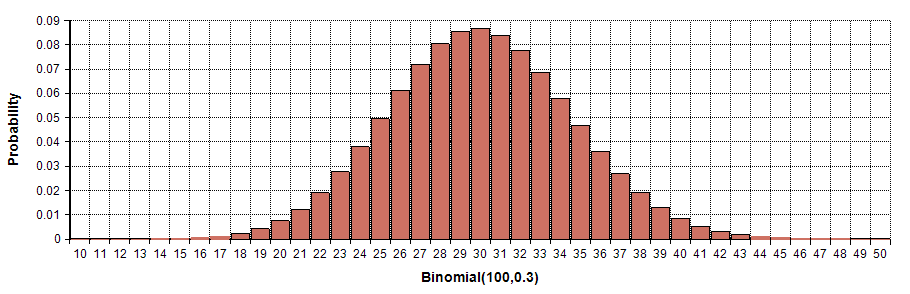
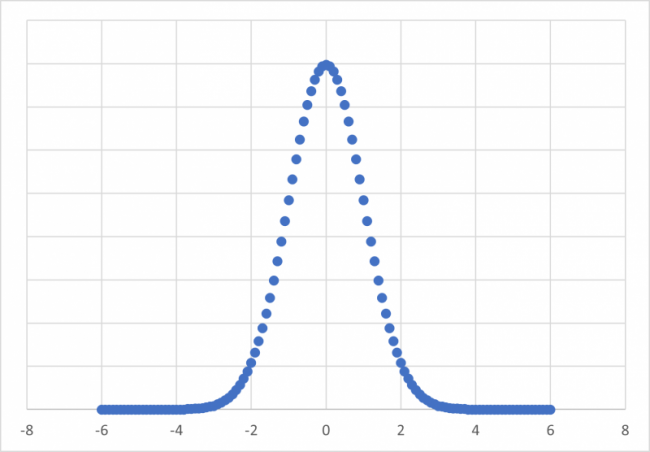
下のグラフと比較してください。第8回の講座で解説した正規分布に似ています。
分布の形から分かるように試行で得たサンプルが増えると正規分布に近づいていることが分かりました。
上述した通り、二項分布の試行回数が増えると正規分布に近づことの証明は非常に複雑であり、マーケターにとっては理解しなくても良い範囲とされています。
まとめ
以上が「データサイエンス力」のNo.11の解説になります。

English
Explain the least squares method, regression coefficient, and standard error for simple regression analysis
Regression analysis has its application in financial analysis and modeling. Before explaining the least square method, regression analysis is briefed.
Regression analysis
Regression analysis is a set of statistical methods used for the estimation of relationships between a dependent variable e.g., y and one or more independent variables e.g., y. It can be utilized to assess the strength of the relationship between variables and for modeling the future relationship between them [14a].
Least square method
The method of least squares is a standard approach in regression analysis to approximate the solution of overdetermined systems (sets of equations in which there are more equations than unknowns) by minimizing the sum of the squares of the residuals made in the results of every single equation [14b].
Regression coefficient
P-values and coefficients in regression analysis work together to tell you which relationships in your model are statistically significant and the nature of those relationships. The coefficients describe the mathematical relationship between each independent variable and the dependent variable. The p-values for the coefficients indicate whether these relationships are statistically significant [14c]. P-values also tell you if these coefficients are significantly different from zero.
If y represents the dependent variable and x the independent variable, this relationship is described as the regression of y on x. The parameter β (the regression coefficient) signifies the amount by which change in x must be multiplied to give the corresponding average change in y, or the amount y changes for a unit increase in x. The regression equation represents how much y changes with any given change of x can be used to construct a regression line on a scatter diagram, and in the simplest case this is assumed to be a straight line. Through the use of a regression coefficient, it represents the degree to which the slope of a line goes upwards or downwards. The direction in which the line slopes depends on whether the correlation is positive or negative. An illustration of how to find regression coefficient is given in the following link [14d]. If you are interested in finding more about this technique please go through the link.
Standard error for simple regression analysis
The standard error of the regression, also known as the standard error of the estimate, represents the average distance that the observed values fall from the regression line. Conveniently, it tells how wrong the regression model is on average using the units of the response variable. Response variables are also known as dependent variables, y-variables, and outcome variables. Smaller values are better because it indicates that the observations are closer to the fitted line.
著者情報