量的変数・質的変数の相関の強さについて解説します。
この範囲は「データサイエンティストのためのスキルチェックリスト」の「データサイエンス力」項目No.12の解説になります。
多くの専門用語や公式が登場しますが丁寧に理解しやすく説明していきます。
本記事はデータサイエンスを研究されているIffat Maabさんによる英語の解説を翻訳しています。
Iffat Maab
東京大学大学院工学系研究科技術経営戦略学専攻(TMI)博士課程在学中。パキスタン、イスラマバード市出身
マーケターのためのデータサイエンスの時間とは?
こちらの講座では、一般社団法人データサイエンティスト協会様がリリースしている「データサイエンティストのためのスキルチェックリスト」に沿った解説を行っていきます。
「データサイエンティストのためのスキルチェックリスト」とは、データサイエンティストとして活躍するために必要なスキルが体系化されたものです。

このマーケターのためのデータサイエンスの時間に従って学習していくと、データサイエンティストに必要なスキルセットである「データサイエンス力」を一通り学習することが出来ます。
<マーケターのためのデータサイエンスの時間の全一覧はこちら>
変数が量的、質的どちらの場合でも関係の強さを算出できる
解答
量的変数:ピアソンの積率相関係数、スピアマンの順位相関係数
質的変数:クラメールの連関係数
を用いて算出することが出来ます。
解説
こちらの問題では量的変数、質的変数が前提になっています。
はじめに、第10の記事から量的変数・質的変数が何かについて確認しましょう。

名義尺度・順序尺度・間隔尺度・比例尺度——4つの尺度水準の違いと使い分けを、具体例とともにわかりやすく解説します。
量的変数の関係の強さ
量的変数の関係の強さを分析する際にはピアソンの相関係数とスピアマンの相関係数の2種類が存在しています。
どちらも聞き慣れない言葉ではありますが、分かりやすく解説を行います。
①ピアソンの相関係数
ピアソンの相関係数は正式には「ピアソンの積率相関係数」という名前です。
数学で「~は相関がある」という言葉を聞いてことがあると思います。実は、その場合の相関係数はピアソンの相関係数を指していることが大半なのです。
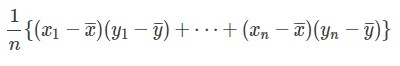
ピアソンの相関係数はこちらの式で求めることが出来ます。

計算過程
共分散は、xの偏差とyの偏差をかけたものの平均になっています。
標準偏差の求め方は第6回の記事で解説しています。ご確認ください。
②スピアマンの相関係数
こちらのスピアマンの相関係数は正式名称で「スピアマン順位相関係数」であり、順序などから相関関係を分析する手法になっています。
スピアマンの相関係数を用いる例としては以下のような、表が順位の表が当てはまります。
| 算数のテストの順位 | 漢字のテストの順位 | |
| Aさん | 1 | 2 |
| Bさん | 3 | 3 |
| Cさん | 5 | 5 |
| Dさん | 4 | 1 |
| Eさん | 2 | 4 |
実は、スピアマンの相関係数はこのような順序をピアソンの相関係数に当てはめて計算するだけになっています。つまり、変数が順位に変換しただけのピアソンの相関係数ということでもあるのです。
質的変数の関係の強さ
質的変数の関係の強さを求める際にはクラメールの相関係数を用いることが出来ます。
クラメールの連関係数
クラメール連関係数とは、項目を掛け合わせて集計する際の行要素と列要素の関連の強さを表す数値のことです。これはクラメールのVと呼ばれることもあります。
項目を掛け合わせて集計する方法はクロス集計法と呼ばれており、以下のような集計が例になります。
男女10人に3つの中から好きな食べ物を聞いた結果を分類した結果です。
| カレー | ラーメン | ハンバーガー | 合計 | |
| 男性 | 6 | 0 | 4 | 10 |
| 女性 | 2 | 4 | 4 | 10 |
| 合計 | 8 | 4 | 8 | 20 |
このような項目を掛け合わせて分類するクロス集計法で、行と列の関連の強さを表す指標がクラメールの相関係数になっています。
クラメールの相関係数は以下の公式で求めることが出来ます。

X²はカイ2乗値と呼ばれるものであり、min(r-1, c-1)はr-1とc-1の小さい方を取るという意味です。
カイ2乗については今後解説を行うため、現段階では「質的変数の関係の強さを求める際は、クラメールの連関連数を使う」と覚えて頂ければ大丈夫です。
まとめ
以上が「データサイエンス力」のNo.12の解説になります。

English
The strength of the relationship can be calculated whether the variable is quantitative or qualitative.
Quantitative data
Quantitative data includes the information about quantities or values. For example, the total number of coins in any given currency, the number of candies in a jar, etc.
Qualitative data
Qualitative data is descriptive, and regards situations which can be observed but not measured [1]. For example, language, the specifications of computer systems in a company, etc.
Correlation is a measure of the direction and strength of the relationship between two quantitative variables. Simple linear regression uses one quantitative variable to predict a second quantitative variable.
The strength of an association can be numerically quantified by using the Pearson Product Moment Correlation. It is represented by the symbol ‘r’. The correlation is used to quantify the association between two continuous variables, (such as revenue, time, or rating scales) [2].
The correlation coefficient varies from an r of –1, which indicates a perfect negative correlation to 1, which means a perfect positive correlation. The figure below shows three examples of scatterplots that show a
- perfect negative correlation with (r = -1),
- no relationships (r = 0), and
- perfect positive relationship (r = 1).
Source: [2]
In practice, correlations are weak to strong. Some examples of correlations of different strengths include [2]:
- Height and Weight: r = .8 (strong correlation)
- Scholastic Aptitude Test (SAT) and First-Year College Grades: r = .5 (average correlation)
- Usability and Customer Loyalty: r = .7 (more than average correlation)
The correlation between variables means that one variable can predict the value of the other variable:
- If you know a customer’s height, you can estimate his/ her weight.
- If you know a customer’s weight, you can estimate his/ her height.
The examples given do not show perfect correlations because the further a correlation is from 1 or –1, the more error is in predicting one variable based on the other.
Usually, in statistics, four types of correlations exist namely Pearson correlation, Kendall rank correlation, Spearman correlation, and the Point-Biserial correlation. There are many softwares available for easy calculation of correlation.
Insights
Data from quantitative research such as market size, demographics, and user preferences provide important information for business decisions. Qualitative research provides valuable data in the design of a product including information about user needs, behavior patterns, customer retention and use cases. Hence, quantitative and qualitative approaches have strengths and each can benefit from combining them with one another.
著者情報