平均値、中央値、最頻値について解説します。
この範囲は「データサイエンティストのためのスキルチェックリスト」の「データサイエンス力」項目No.3の解説になります。
多くの専門用語や公式が登場しますが丁寧に理解しやすく説明していきます。
本記事はデータサイエンスを研究されているIffat Maabさんによる英語の解説を翻訳しています。
Iffat Maab
東京大学大学院工学系研究科技術経営戦略学専攻(TMI)博士課程在学中。パキスタン、イスラマバード市出身
マーケターのためのデータサイエンスの時間とは?
こちらの講座では、一般社団法人データサイエンティスト協会様がリリースしている「データサイエンティストのためのスキルチェックリスト」に沿った解説を行っていきます。
「データサイエンティストのためのスキルチェックリスト」とは、データサイエンティストとして活躍するために必要なスキルが体系化されたものです。

このマーケターのためのデータサイエンスの時間に従って学習していくと、データサイエンティストに必要なスキルセットである「データサイエンス力」を一通り学習することが出来ます。
平均(相加平均)、中央値、最頻値の算出方法の違いを説明できる
解答
平均値(相加平均):データセット内の数値を全て足し、データの数で割った値。言い換えると、合計/個数で求められた値。
中央値:データセットを昇順・降順に並べたときの真ん中の値。
最頻値:データセットで最も見られる値。
解説
今回は平均値・中央値・最頻値の求め方に関する問いです。
これらを解説する前に、今回の解説で頻繁に使われる「データセット」という言葉の意味について説明します。
データサイエンスの分野で頻繁に用いられる言葉であり、データセットとは「データの集合」の事を指しています。
それでは、それぞれの意味と算出方法を確認していきます。
平均値
平均値は、与えられたデータのすべての数値を足し、データ数で割ることで求められます。
実は平均には相加平均と相乗平均の2種類があるのですが、今回は全て足し合わせて計算する方の相加平均を扱います。相乗平均は全てを掛け合わせて計算します。
例えば、「あるクラスに7人の生徒がいて、彼らは数学の試験で79、79、34、75、79、81、92点を獲得した」とします。
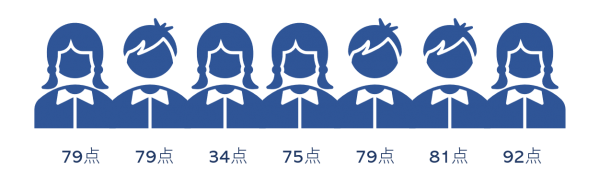
そこで彼らの平均は、
平均値 = (79 + 79 + 34 +75 + 79 + 81 + 92) / 7 =74.1 として求められます。
中央値
中央値とは、データセットを小さいものから大きいものへと順に並べたときの、真ん中の値のことです。
奇数個の要素から中央値の位置を求めるには、次のような計算式を用います。
中央値の位置=(N + 1) / 2
Nはデータセットの数です。
与えられた要素は「79, 79, 34, 75, 79, 81, 92」です。
まず、データセットを昇順に並べると34, 75, 79, 79, 79, 81, 92
データセット内のデータの数は7なので、中央値の位置は、
(7 + 1) / 2 = 4位 と分かります。
そのため、並べられたデータの4番目の位置の79が、中央値であると分かります。
最頻値
最頻値とは、データセットの中で最も頻繁に出現する数字のことです。
与えられたデータセットから明らかなように,最も頻度の高い値は79でありこれは与えられたデータセットの中で3回繰り返されている値になっています。
何の為に平均値、中央値、最頻値は用いられるのか
これらの平均値、中央値、最頻値はデータの傾向を表すものために不可欠となっています。これらは、中心傾向と呼ばれており、他にもモード、ピタゴラス平均などデータの傾向を表す様々な中心傾向が存在しています。
このように、膨大なデータを扱う際にはデータ全体の特徴を分かりやすく見るための値が必要になっているのです。
まとめ
以上が「データサイエンス力」のNo.3の解説になります。

English
Explain the difference in calculation method of mean (arithmetic mean), median, and mode
Mean
The mean (average) of a data set is found by adding all numbers in the data set and then dividing by the number of values in the set. For example there are seven students in a class and they obtained 79, 79, 34, 75, 79, 81, 92 marks in a Mathematics exam. Their mean is
Mean = (79 + 79 + 34 +75 + 79 + 81 + 92) / 7 =
Median
The median is the middle value when a data set is ordered from least to greatest (ascending order). In order to find the location/ position of a median from odd number of elements the formula used is
(N + 1) / 2.
Elements given:
79, 79, 34, 75, 79, 81, 92
First arranging the elements in ascending order:
34, 75, 79, 79, 79, 81, 92
Location of the median:
(N + 1) / 2 = (7 + 1) / 2 = 4th position
Median:
= 79 ( 4th location of the arranged elements)
Mode
The mode is the number that occurs most often in a data set. It is obvious from the given data set that the most frequent value is 79 which is mode i.e., repeated thrice in the given dataset.
Purpose
The use of mean, median and mode is used in statistical inference. A measure of central tendency is a single value that attempts to describe a set of data by identifying the central position within that set of data. The arithmetic mean sometimes called ‘the average’ gives an idea of where the central tendency of the distribution is located. If you plot a histogram of the distribution, the mean gives the point where the distribution has the tendency to centralize itself i.e., the mass to the right equals the mass to the left.
The median, on the other hand, gives the point which divides the distribution into two halves, i.e., there are the same number of values to the right and to the left of the median, that is why the median is also called the second quartile. Sometimes the median is a better measure of location than the mean, for instance in asymmetrical distributions. If you want to calculate the ‘typical’ salary of an employee of a corporation, the high salaries of a few executives would shift the mean towards an unrepresentative value whilst the median would be little affected by a few high salaries [5a].
The mode is the point where the peak of the distribution occurs, i.e., where most samples concentrate.
著者情報